VPC Statistics
 We’ve added a new function to The Virtual Private Cloud to make managing virtual machines even more convenient and cost-effective: workload statistics.
Users can now view graphs on the workloads of virtual machine components from the control panel or gather measurement data over REST API.
In this article, we’ll talk about the components used for gathering, processing, and storing virtual machine metrics as well as give examples of how these components can be configured.
The component responsible for gathering and processing metrics in OpenStack is Ceilometer.
For a long time, this was the only OpenStack component that provided all of the basic telemetry functions.
As time went on, the developers broke Ceilometer’s functions into multiple products:
- Aodh — alerts and triggers
- Gnocchi — data aggregation and storage
- Panko — event information storage
- Ceilometer — data collection
We won’t be looking at Aodh or Panko in this article.
Collecting Data — OpenStack Ceilometer
Ceilometer can gather measurements on CPU, RAM, network interface, and disk usage, as well as temperatures from different sources:
- directly from the hypervisor (KVM, Hyper-V, XEN, VMware)
- from a message queue (RabbitMQ, ZeroMQ, Kafka)
- by requesting information from other OpenStack components via REST API
- by requesting hardware information over SNMP or IPMI
Ceilometer used to have an API for managing already collected measurements, metrics, and resources; however, this function was removed with the release of OpenStack Ocata because Gnocchi, which has its own fully-functioning API for managing these objects, became the primary backend for Ceilometer.
We tried to use Ceilometer from OpenStack Juno a few years ago.
Our first VPC billing instance would send it reports, where they were available to service programs and authorized users (with an OpenStack Keystone token).
At that time, the primary backends for Ceilometer were SQL databases and MongoDB. Unfortunately, both options failed to handle the workloads after half a year of use; the structure of the data we collected was too freeform, unindexed, and overly detailed.
Each measurement was saved in its initial state, without any aggregation or changes. With large amounts of data, simple operations to fetch measurements for a given period started taking an extremely long time and the service was impossible to use.
To overcome the architectural problems, the OpenStack telemetry development team founded a new project under the name Gnocchi in 2014. A detailed description of why and how they did this can be found in Julien Danjou’s blog: OpenStack Ceilometer and the Gnocchi experiment.
Ceilometer Architecture
The Ceilometer architecture can be visualized as follows:
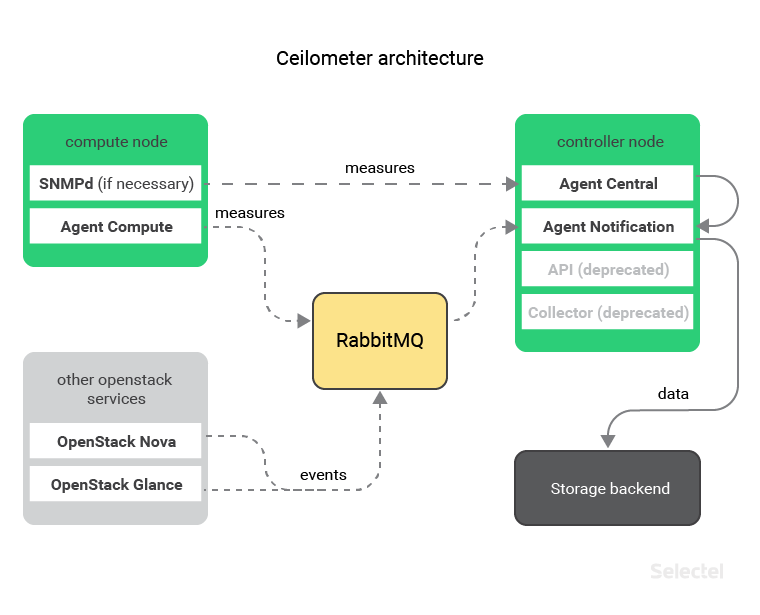
Every host equipped with a hypervisor also has the Compute agent, which gathers data from virtual machines. The data is then transferred to the central Notification agent via message queues.
If you need to collect data on physical host workloads, then we can install and use an SNMP agent. In this case, data will be gathered by the Central agent.
After being processed, the data will be sent to the Notification agent, which sends it to the selected backup for storage.
The central Notification agent can also gather information on other OpenStack component events by listening in on message queues. This proves useful if information has to be monitored and stored on the creation, modification, and deletion of servers, disks, and ports.
Until recently (or more specifically, until the release of OpenStack Ocata this past February), another component had to be installed alongside the Ceilometer Notification and Central agent: Collector.
This component is no longer needed as all of its functions are performed by the Ceilometer Notification agent.
Configuring Ceilometer
The main Ceilometer configuration files are:
- ceilometer.conf — describes all of Ceilometer’s basic parameters (logging, message queue usage, authentication, Ceilometer process coordination, etc.)
- pipeline.yaml — describes which information to gather and from where
- gnocchi_resources.yaml — describes correlations between Ceilometer and Gnocchi objects (we’ll discuss this more later on)
You can download or generate a ceilometer.conf template with all of the available options from the official documentation: Ceilometer Configuration Options.
Pipeline.yaml has to be filled in manually.
Example:
---
sources:                        # Data source
  - interval: 600               # Interval for retrieving data (seconds)
    meters:                     # List of metrics
      - memory.usage            # Memory to use inside the virtual machine (MB)
      - memory.resident         # Memory that can be used by the virtual machine on the host (MB)
    name: memory_meters         # Measurement source name
    sinks:                      # List of data recipients

 - memory.sink                  # Name of data recipient
  - interval: 600               # Interval for retrieving data (seconds)
    meters:                     # List of metrics
      - disk.device.read.bytes  # Total number of bytes read on disk
      - disk.device.write.bytes # Total number of bytes written on disk
    name: disk_meters           # Measurement source name
    sinks:                      # List of measurement sinks
      - disk_sink               # Name of measurement sink

sinks:                          # Measurement sinks
  - name: memory_sink           # Name of data recipient  (used by "memory_meters" source)
    publishers:                 # List of storage backends where measurements will be written
      - gnocchi://              # Uses only Gnocchi backend

  - name: disk_sink             # Name of data recipient (used by "memory_meters" source)
    publishers:                 # List of backends for saving measurements
      - gnocchi://              # Used only for Gnocchi backend (we will discuss this below)
We can additionally indicate transformations for data gathered. For example, we can transform all of the memory.usage and memory.resident metric values from megabytes to kilobytes. At the same time, we can rename these metrics and add units of measurements to them.
To do this, we’ll have to edit the memory_sink consumer as follows:
sinks:
  - name: memory_sink
    transformers:
      - name: "unit_conversion"                 # We use the integrated unit_conversion method
        parameters:
          source:
            map_from:
              name: "memory\\.(usage|resident)" # What to rename
          target:
            map_to:
              name: "memory.\\1.kilobytes"      # How to rename
            scale: "volume * 1024.0"            # How to transform the value
            unit: "KB"                          # Add measurement units
    publishers:
      - gnocchi://
More information about this format and how to apply other transformations can be found in the official documentation: Data processing and pipelines.
Next we’ll look at Gnocchi, which lets you save aggregated measurements and provides an API for managing them.
Data Storage – Gnocchi
Gnocchi is a time-series database. We should note that at the start of May 2017, the Gnocchi developers decided to break away from the OpenStack infrastructure.
The code base was migrated to GitHub, and GitHub Issues became the bugtracker. One of the main reasons for the move was to position Gnocchi as a universal product for any solution, not just a Ceilometer backend. There are already plugins in the Gnocchi repository for saving data from Collectd and drawing graphs in Grafana.
Let’s take a closer look at this device and its features.
Gnocchi Architecture
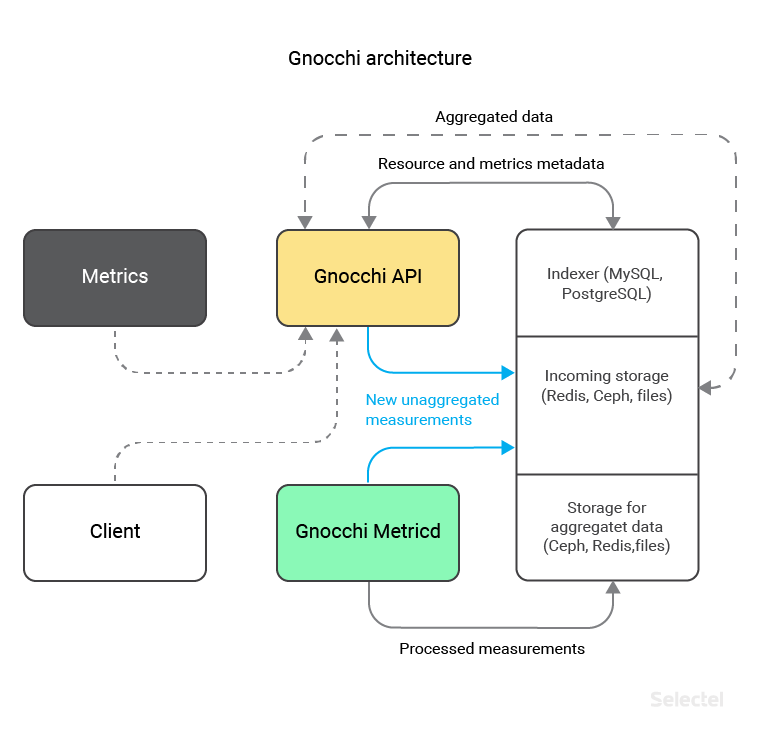
Gnocchi consists of 2 main components:
- API, through which data (which is either entered manually or gathered from programs like Ceilometer) is saved and updated as well as from which aggregate data is received
- Metricd — a daemon which processes recently received and still unsorted data, and then saves them in user-defined storage (Ceph, Redis, OpenStack Swift or on a local file system) in the proper format
As of version 3.1, Gnocchi has supported different kinds of storage for processed and unprocessed data. This distinction lets you store “hot” unaggregated data in a faster storage (like Redis, which has been supported by Gnocchi since version 4.0), while aggregated data can be stored in a more reliable, scalable backend (like Ceph, which has been supported since the initial version of Gnocchi).
Despite direct data storage, Gnocchi also requires an additional SQL database where metric indices and their metadata are stored. This can be done with MySQL or PostgreSQL. Gnocchi uses its own approach for saving measurements, since all of the listed technology doesn’t let it save data as a time series.
Saving Data in Gnocchi
When new data is received, values aren’t stored as-is; instead, they are aggregated using custom methods (in our example, this is minimum, maximum, and mean) and saved with a user-defined granularity (in our example this is 3600 seconds) according to the archiving policy created.
We can create an archiving policy using the python-gnocchiclient console client. As an example, we’ll create a policy with the name memory_policy, which contains three aggregation methods—minimum, maximum, and mean—and 2 definitions of how data will be saved. The first definition says that we’ll save data with a granularity of 1 hour for 7 days. The second says that we’ll save data with a granularity of 1 day for 1 year.
Additionally, we’ll set the back window value to 72, which lets us save not only metrics created now, but older metrics that have hung for whatever reason for no longer than 72 days.
controller:~# gnocchi archive-policy create memory_policy \
> -b 72 \
> -m min -m max -m mean \
> -d 'granularity:1h,timespan:7d' \
> -d 'granularity:1d,timespan:365d'
Our response will be a policy description:
+---------------------+-------------------------------------------------------------------------+
| Field               | Value                                                                   |
+---------------------+-------------------------------------------------------------------------+
| aggregation_methods | max, min, mean                                                          |
| back_window         | 72                                                                      |
| definition          | - points: 168, granularity: 1:00:00, timespan: 7 days, 0:00:00          |
|                     | - points: 365, granularity: 1 day, 0:00:00, timespan: 365 days, 0:00:00 |
| name                | memory_policy                                                           |
+---------------------+-------------------------------------------------------------------------+
Please note that the points were automatically calculated for the definitions. This is done using the formula:
Points = Timespan / Granularity
The computation requires you have the disk space that the values of the saved metrics will take up. The Gnocchi developers suggest using the following formula for calculating this:
Size (in bytes) = 8 * points * aggregation methods
This formula is the worst case scenario, since information is always compressed when saved. Using this formula, we can calculate the amount of space for the memory_policy archiving policy. For the first definition (1 hour granularity for 7 days) we get 4032 bytes:
4032 (bytes) = 8 * 168 * 3
For the second definition (1 day granularity for a year) we get 8760 bytes:
8760 (bytes) = 8 * 365 * 3
This value reflects the space used for saving one metric according to memory_policy.
If we collect 2 metrics—memory.usage and memory.resident—for 2000 virtual machines, then we’ll need:
2000 * 2 * 4032 (bytes) = 16.128 MB (for 7 days)
2000 * 2 * 8760 (bytes) = 35.04 MBytes (for 1 year)
Gnocchi Resources
All of the metrics that Gnocchi saves pertain to various resources. A resource is an abstract object, which can contain several metrics as well as have additional fields describing the resource type.
The interaction between metric objects, resources, and resource types looks like this:
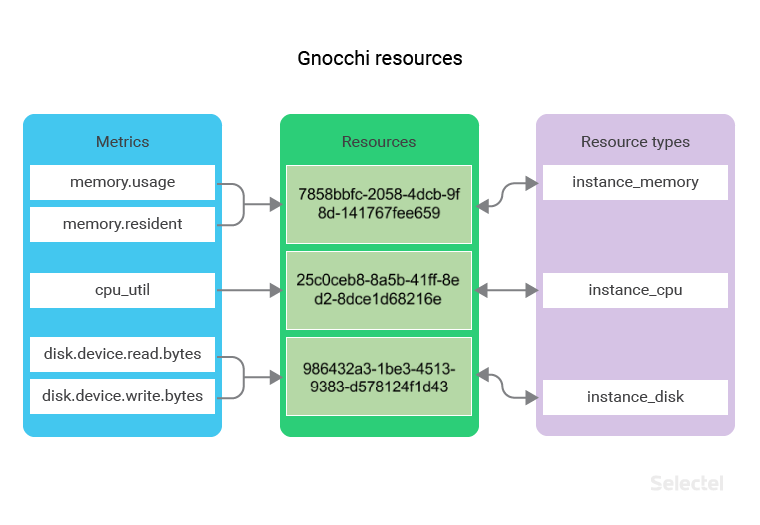
As an example, let’s say we have a set of instance_memory resource types. Each of these resources contains the memory.usage and memory.resident metric.
If we gather metrics from 2000 virtual machines, then the number of instance_memory resources will also be 2000.
For these resources, it may be useful to save additional information, such as the name of the hypervisor host where the virtual machine is launched or an identifier of the OS image (saved in the OpenStack Glance service) that was used to create the virtual machine.
We’ll create an instance_memory resource type in the console. We enter descriptions in the additional host field and image_ref field for storing the host name and image ID, and make the host field mandatory.
controller:~# gnocchi resource-type create instance_memory \
> -a host:string:true:min_length=0:max_length=255 \
> -a image_ref:string:false:min_length=0:max_length=255
Our response will be a description of the resource type:
+----------------------+-----------------------------------------------------------+
| Field                | Value                                                     |
+----------------------+-----------------------------------------------------------+
| attributes/host      | max_length=255, min_length=0, required=True, type=string  |
| attributes/image_ref | max_length=255, min_length=0, required=False, type=string |
| name                 | instance_memory                                           |
| state                | active                                                    |
+----------------------+-----------------------------------------------------------+
We will similarly create instance_cpu and instance_disk resource types. The first will have the same additional fields as instance_memory, and the second will have an instance_id field, which gives the ID of the server the disk is connected to:
controller:~# gnocchi resource-type create instance_cpu \
> -a host:string:true:min_length=0:max_length=255 \
> -a image_ref:string:false:min_length=0:max_length=255

+----------------------+-----------------------------------------------------------+
| Field                | Value                                                     |
+----------------------+-----------------------------------------------------------+
| attributes/host      | max_length=255, min_length=0, required=True, type=string  |
| attributes/image_ref | max_length=255, min_length=0, required=False, type=string |
| name                 | instance_cpu                                              |
| state                | active                                                    |
+----------------------+-----------------------------------------------------------+

controller:~# gnocchi resource-type create instance_disk \
> -a instance_id:uuid:true

+------------------------+--------------------------+
| Field                  | Value                    |
+------------------------+--------------------------+
| attributes/instance_id | required=True, type=uuid |
| name                   | instance_disk            |
| state                  | active                   |
+------------------------+--------------------------+
Now we’ll look at how we can start saving Ceilometer metrics in Gnocchi using the resource types we’ve created.
Configuring Ceilometer + Gnocchi
For Ceilometer to use Gnocchi as a backend, you have to:
1. Add the meter_dispatchers option to ceilometer.conf:
[DEFAULT]
meter_dispatchers = gnocchi
2. Create gnocchi_resources.yaml, which describes the correlation between the Ceilometer metrics and Gnocchi resource types, as well as indicates the resource types’ additional fields:
---
resources:
  - resource_type: instance_memory           # Resource type for the metric
    metrics:
      - 'memory.usage'                       # Metric of usable memory within the virtual machine
      - 'memory.resident'                    # Metric of usable memory within the virtual machine on the host
    attributes:
      host: resource_metadata.instance_host  # Metadata of the virtual machine host
      image_ref: resource_metadata.image_ref # Metadata of the virtual machine image

  - resource_type: instance_disk             # Resource type for the metric
    metrics:
      - 'disk.device.read.bytes'             # Metric of total number of bytes read on the disk
      - 'disk.device.write.bytes'            # Metric of total number of bytes written on the disk
    attributes:
      instance_id: resource_metadata.instance_id      # Metadata with virtual machine ID

  - resource_type: instance_cpu              # Resource type for the metric
    metrics:
      - 'cpu_util'                           # Metric of CPU usage within the virtual machine
    attributes:
      host: resource_metadata.instance_host  # Metadata of the virtual machine host
      image_ref: resource_metadata.image_ref # Metadata of virtual machine image
After launching Ceilometer, data will be gathered and sent to Gnocchi (provided it was configured according to the documentation).
You can track the status of new data being processed and aggregated in storage using the command:
controller:~# gnocchi status
+-----------------------------------------------------+-------+
| Field                                               | Value |
+-----------------------------------------------------+-------+
| storage/number of metric having measures to process | 93    |
| storage/total number of measures to process         | 93    |
+-----------------------------------------------------+-------+
We can see in this printout that Gnocchi-metricd has 93 measurements to process from 93 metrics.
With this command, we can see if the Gnocchi-metricd component is handling incoming metrics.
The processing speed directly depends on the number of Gnocchi-metricd processes and performance of our data storage.
Displaying Aggregate Information
After our measurements are processed and saved, we’ll be able to access Gnocchi resources and measurements.
We’ll print out resources with the instance_memory resource type, limit the output to three resources, and display only four columns: resource id, type, host name, and image id:
controller:~# gnocchi resource list --type instance_memory --limit 3 --column id --column type --column host --column image_ref
+--------------------------------------+-----------------+-----------+--------------------------------------+
| id                                   | type            | host      | image_ref                            |
+--------------------------------------+-----------------+-----------+--------------------------------------+
| 945ad3cc-2617-4b19-a681-5a1cb96d71e1 | instance_memory | compute00 | 3456e843-b7fe-42be-8c4c-0c7d1c2d09c7 |
| e33c895f-e38a-4f8e-be07-8fe0d7c8275f | instance_memory | compute02 | 27bbfeb7-0706-4d11-bb59-f98d6b08dc1c |
| 023fed66-3fdd-43b6-b02e-325da55b62cc | instance_memory | compute04 | f0f5e0aa-4615-462e-8340-b8258aae90e2 |
+--------------------------------------+-----------------+-----------+--------------------------------------+
To view the available metrics and resource type for resource 945ad3cc-2617-4b19-a681-5a1cb96d71e1:
controller:~# gnocchi resource show --column metrics --column type 945ad3cc-2617-4b19-a681-5a1cb96d71e1
+---------+-------------------------------------------------------+
| Field   | Value                                                 |
+---------+-------------------------------------------------------+
| metrics | memory.resident: f56b76ad-5ce8-49fe-975f-6e5da412df31 |
|         | memory.usage: aa757f46-52b9-40de-898c-524dfe29b7bc    |
| type    | sel_instance                                          |
+---------+-------------------------------------------------------+
Let’s print out the mean measurement values for metric aa757f46-52b9-40de-898c-524dfe29b7bc taken from 12:00 – 18:00 on April 25, 2017 with one hour granularity:
controller:~# gnocchi measures show --aggregation mean --granularity 3600 --start 2017-08-25T12:00 --stop 2017-08-25T18:00 aa757f46-52b9-40de-898c-524dfe29b7bc

+---------------------------+-------------+---------------+
| timestamp | granularity   | value       |               |
+---------------------------+-------------+---------------+
| 2017-08-25T12:00:00+00:00 | 3600.0      | 2231.75       |
| 2017-08-25T13:00:00+00:00 | 3600.0      | 2238.66666667 |
| 2017-08-25T14:00:00+00:00 | 3600.0      | 2248.58333333 |
| 2017-08-25T15:00:00+00:00 | 3600.0      | 2259.08333333 |
| 2017-08-25T16:00:00+00:00 | 3600.0      | 2240.41666667 |
| 2017-08-25T17:00:00+00:00 | 3600.0      | 2249.66666667 |
+---------------------------+-------------+---------------+
Aggregate information can also be retrieved using REST API. Let’s look at a few examples:
To retrieve values for memory.usage metrics for instance_memory resource types with a granularity of 24 hours starting from 28.08.2017:
controller:~# curl -XGET \
> -H 'Content-Type: application/json' \
> -H 'X-Auth-Token: KEYSTONE_TOKEN' \
> 'controller:8041/v1/resource/instance_memory/684f5b56-2c06-485a-ae1a-66ab5c4175fb/metric/memory.usage/measures?start=2017-08-28&granularity=86400' \
> | python -m json.tool

[
    [
        "2017-08-28T00:00:00+00:00",
        86400.0,
        2645.9444444444443
    ],
    [
        "2017-08-29T00:00:00+00:00",
        86400.0,
        2671.625
    ],
    [
        "2017-08-30T00:00:00+00:00",
        86400.0,
        2681.5438596491226
    ]
]
To search for instance_memory resource types created after 29.08.2017 with the value “compute19” in the host field:
controller:~# curl -XPOST \
> -H 'Content-Type: application/json' \
> -H 'X-Auth-Token: KEYSTONE_TOKEN' \
> 'controller:8041/v1/search/resource/instance_memory \
> -d '{
>   "and": [
>     {
>       "=": {
>         "host": "compute19"
>       }
>     },
>     {
>       ">": {
>         "started_at": "2017-08-29"
>       }
>     }
>   ]
> }' \
> | python -m json.tool
[
    {
        "created_by_project_id": "99288fd3d178459f808c1e8bc2cf9e49",
        "created_by_user_id": "7dd0582d38aa471bbe8995f63a1293a9",
        "creator": "7dd0582d38aa471bbe8995f63a1293a9:99288fd3d178459f808c1e8bc2cf9e49",
        "ended_at": null,
        "host": "compute19",
        "id": "9052e237-ad17-47be-8aa5-10aacbf6717f",
        "image_ref": "e12ef13d-783c-4030-9251-ad2c8e270453",
        "metrics": {
            "memory.resident": "365db8ce-f4f7-4e59-ac9f-03dcdfe81195",
            "memory.usage": "084157b7-09d3-45e7-a869-fad62062025a"
        },
        "original_resource_id": "9052e237-ad17-47be-8aa5-10aacbf6717f",
        "project_id": "99288fd3d178459f808c1e8bc2cf9e49",
        "revision_end": null,
        "revision_start": "2017-08-30T20:35:19.214598+00:00",
        "started_at": "2017-08-30T20:35:19.214577+00:00",
        "type": "instance_memory",
        "user_id": "7dd0582d38aa471bbe8995f63a1293a9"
    }
]
To retrieve an aggregate of the maximum values for the memory.resident metric with a granularity of up to 1 hour for virtual machines launched on host compute19; metrics are systematized by project ID:
controller:~# curl -XPOST \
> -H 'Content-Type: application/json' \
> -H 'X-Auth-Token: KEYSTONE_TOKEN' \
> 'controller:8041/v1/aggregation/resource/instance_memory/metric/memory.resident&aggregation=max&granularity=3600&groupby=project_id' \
> -d '{
>   "=": {
>     "host": "compute19"
>   }
> }' \
> | python -m json.tool
[
  {
    "group": {
      "project_id": "eef577b17cfe4432b7769d0078dbb625"
    },
    "measures": [
      [
        "2017-08-29T09:00:00+00:00",
        3600,
        735
      ],
      [
        "2017-08-30T11:00:00+00:00",
        3600,
        949
      ]
    ]
  },
  {
    "group": {
      "project_id": "b998dbbb9b02474c9dc49ffc289eae8c"
    },
    "measures": [
      [
        "2017-08-29T09:00:00+00:00",
        3600,
        612
      ],
      [
        "2017-08-30T11:00:00+00:00",
        3600,
        642
      ]
    ]
  }
]
Other REST API examples are available in the official documentation.
VPC Statistics
These are the components we currently use for the VPC.
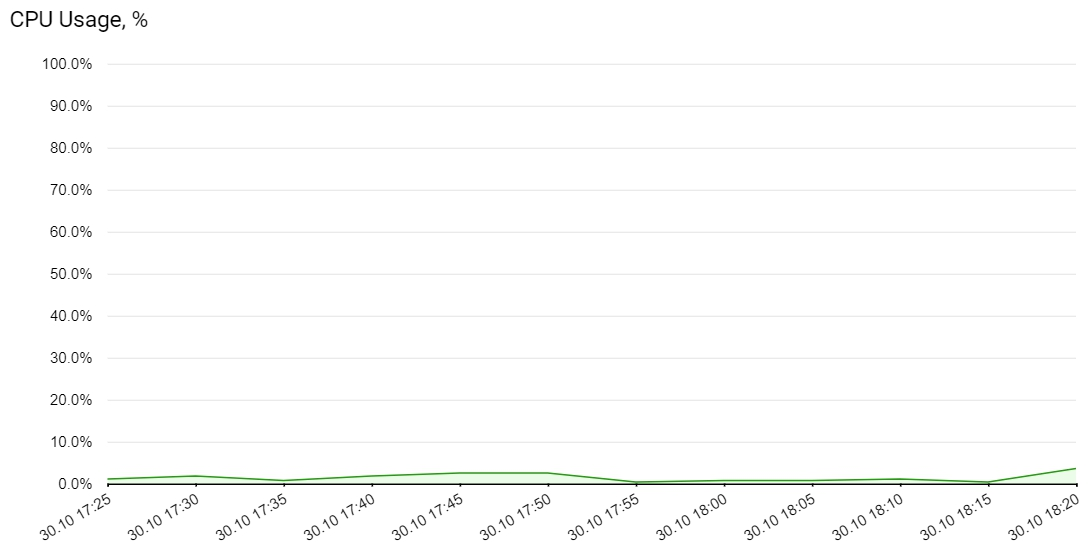
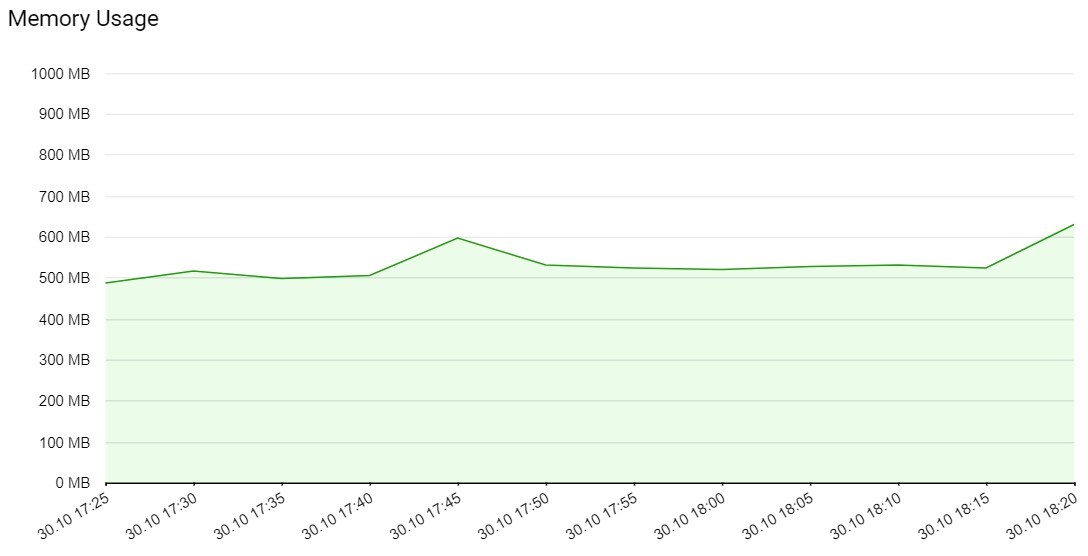
Users can access the following metrics for their virtual machines:
- Processor utilization, in % (cpu_util)
- RAM usage, in MB (memory.usage)
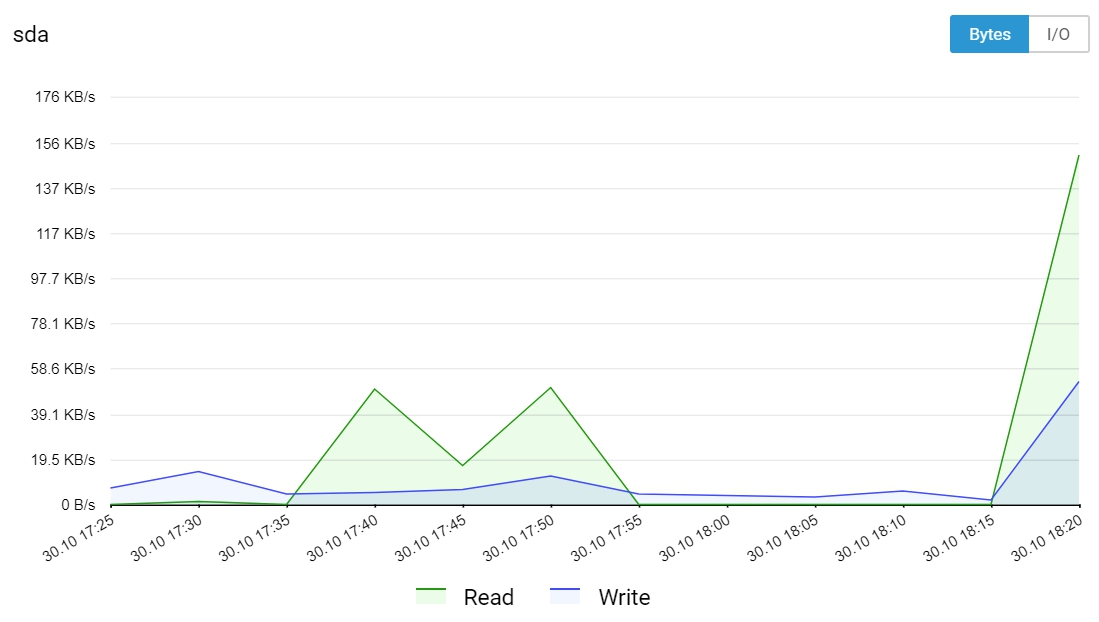
Disk metrics:
- Number of bytes/s for read and write operations (disk.device.read.bytes, disk.device.write.bytes)
- Number of read and write requests per second (disk.device.read.requests, disk.device.write.requests)
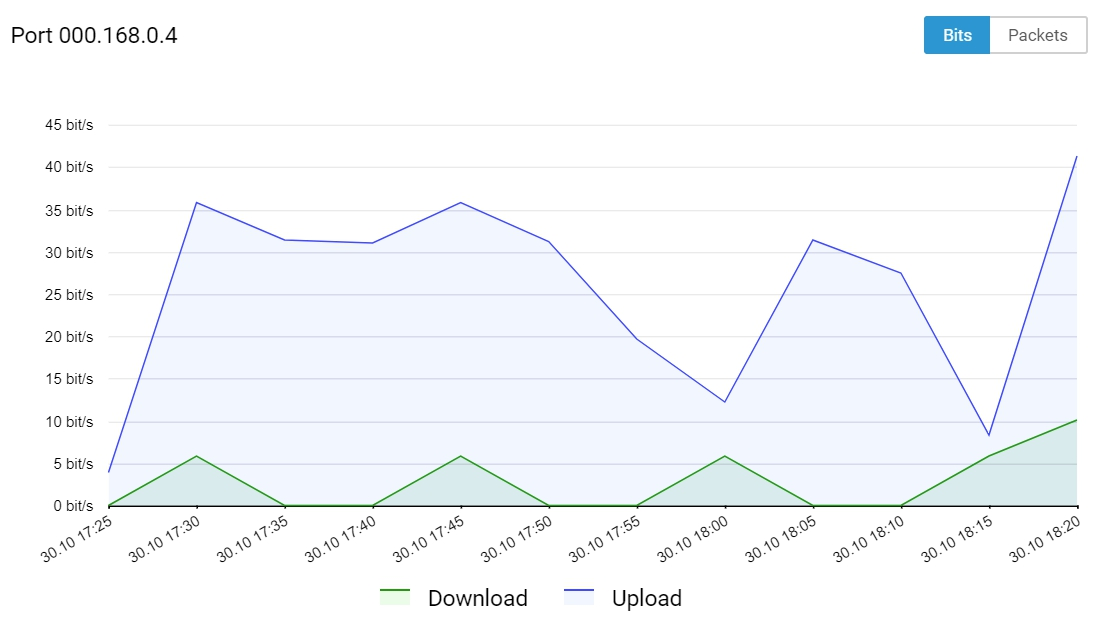
Network metrics:
- Number of bits/s for incoming and outgoing traffic (network.incoming.bits, network.outgoing.bits)
- Number of packets of incoming and outgoing traffic per second (network.incoming.packets, network.outgoing.packets)
All of this data can be obtained from the REST API, Gnocchi console client, or as graphs in the server control panel.
CPU Usage
RAM Usage
Disk Workload
Network Workload
You can read more about these statistics in our knowledge base.
Conclusion
In this article, we looked at two components for gathering, saving, and displaying statistics on OpenStack objects. If you have any questions, feel free to ask in the comments below.
If you would be interested in trying gnocchi as a service where you can write your own data, please tell us about it.
We’d also be happy to hear your experiences using Ceilometer or Gnocchi.