Bcache against Flashcache for Ceph Object Storage
Fast SSDs are getting cheaper every year, but they are still smaller and more expensive than traditional HDD drives. But HDDs have much higher latency and are easily saturated. However, we want to achieve low latency for the storage system, and a high capacity too.
There’s a well-known practice of optimizing performance for big and slow devices — caching. As most of the data on a disk is not accessed most of the time but some percentage of it is accessed frequently, we can achieve a higher quality of service by using a small cache.
Server hardware and operating systems have a lot of caches working on different levels. Linux has a page cache for block devices, a dirent cache and an inode cache on the filesystem layer. Disks have their own cache inside. CPUs have caches. So, why not add one more persistent cache layer for a slow disk?
In this article, we’ll be explaining what we used, what problems we’ve had and how we solved them by replacing block device caching software. We’ll start with an issue we’ve been having with flashcache in our Ceph cluster with HDD backend.
The Environment
Ceph is a modern software-defined object storage. It can be used in different ways, including the storage of virtual machine disks and providing an S3 API. We use it in different cases:
- RBD devices for virtual machines.
- CephFS for some internal applications.
- Plain RADOS object storage with self-written client.
The last one is the one we’ll be talking about here.
The architecture of this cluster was not perfect. When the problem occurred, we had about 10 servers with 24 HDD disks in each one. Plus, we had 5 cache tiering servers, which we will not talk about in this article (we would mention here that cache-tiering was a mistake, which we’re getting away from).
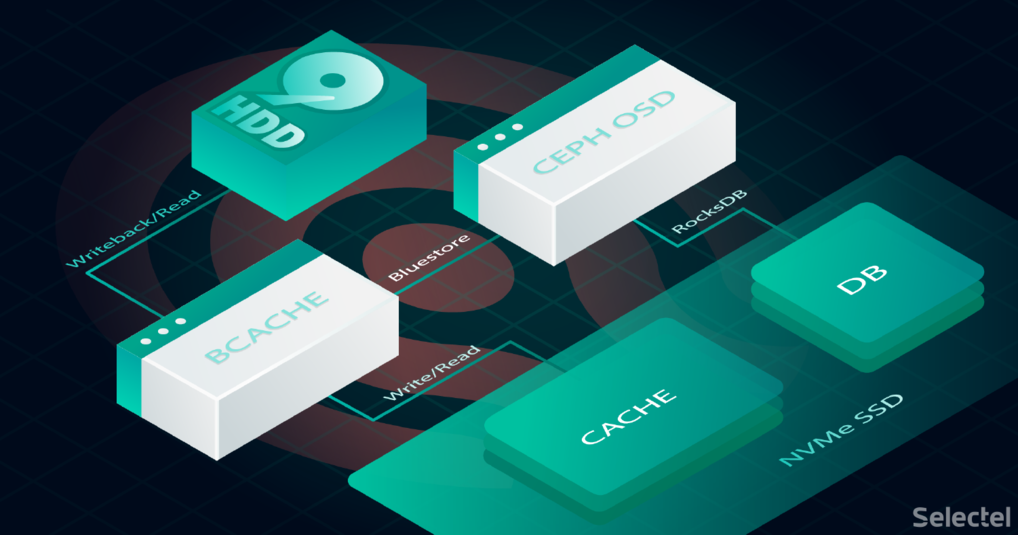
Every 24-HDD server has an NVMe SSD, which was split for 48 partitions (actually, it was a RAID-1 array of 2 NVMes, but now we just use two NVMe devices separately). So there’s one partition for the OSD journal and one partition for a cache for each OSD daemon.
The Flashcache
What is flashcache? It is a kernel module initially developed by Facebook, which allows caching of a drive on another drive. It is built using the device mapper and can work in four different modes: write-through, write-around, write-back and write-only. The documentation can be found here. Write-around and write-through caches are not persistent across device removals and reboots. As most of the time, we need to cache read and write workloads, we used the write-back mode.
Flashcache can be added to a device that is already in use. This is one of its benefits. All it needs to do is just stop the service, create a cache device and start the service using the newly created virtual flashcache device. Like all device mapper-based devices, Flashcache devices will be named dm-[0-9] in the system.
We have been using flashcache for a long period of time as a caching layer for Ceph with virtual machine’s disks. As described in the documentation, it was developed for random read/write workload. We’re able to configure the «sequential threshold», though, which is the maximum size of a request in kilobytes that will be cached. All requests greater than the specified size will be passed through the cache to the slow device.
Because our experience with it has been good, we’ve tried to start using it under different workload: with Ceph and self-written clients over RADOS.
The Problem
As soon as we started using flashcache in a different way, things changed. The first issue was with flashcache’s locking behavior. There was a bug, which led to a deadlock. Under high memory pressure, when flashcache needed to free some memory, it had to start a new thread to do so. But to start a new thread, it needed to allocate memory, which was impossible. The result of this bug was a sudden host hang.
Another problem we faced was the high rate of HDD utilization, which was higher the larger the cluster became. Different disks were utilized up to 100% for dozens of seconds. To understand what was happening, we started studying the workload profile. We were actively using a Ceph cache tier at that time and it was extremely hard to predict what kind of workload was being generated by its internal mechanisms, but at least it could promote and evict objects.
So we knew that we had cache-tier eviction and promotion, flashcache dirty blocks cleaning and Ceph recovery operations. All of those operations might cause a high HDD utilization rate potentially. We started tracing HDD operations to better understand what’s going on. The first result was as expected. There were a lot of recovery operations passing through the cache.
Understandably, there would be a high rate of HDD utilization caused by sequential reads during a recovery process because of its sequential nature, but we saw the same problems when the cluster was in a stable state. We then seized the opportunity to trace block requests while the utilization rate was high and no recovery was happening. We used blktrace for tracing and btt with bno_plot script to build 3d graphs:
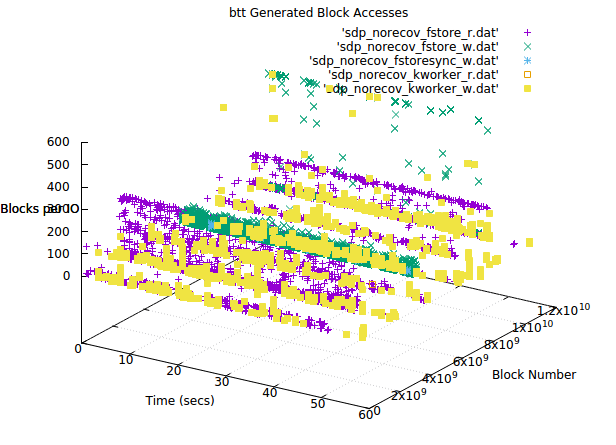
There are three main threads working with HDD at the same time in this picture:
- The flashcache dirty blocks cleaning thread (kworker on the image), which was writing on the disk.
- The Ceph OSD filestore thread, which was reading and asynchronous writing to the disk.
- The filestore sync thread, which was sending fdatasync() to the dirty blocks, when the OSD journal had to be cleared.
What does all this mean? It means that sometimes we had a sequential workload from the Ceph OSD daemon. And sometimes we had flashcache dirty block cleaning operations. When these operations happened in the same period of time, we faced HDD device saturation.
Tuning Flashcache
Flashcache’s cache structure is a set associative hash. The cache device is divided into parts called sets. Each set is divided into blocks. Slow devices are divided into parts, each of which has an associated set. As the caching disk is much smaller, every set is associated with more than one slow device part.
When flashcache tries to put some data on the disk, it has to find a set for it. Then it has to find a place on the cache inside the set where a new block could be stored. While the cache set lookup is fast because it’s mapped using the block number, block lookup inside the set is just a linear search for a free (or a clean) space.
As you can see from the graphs, we have to make flashcache deal with dirty blocks more gently. But the problem here is that all the settings around dirty blocks cleaning are related to sets. There’s no IO feedback control mechanism that could help us. According to the documentation:
dev.flashcache.<cacheddev>.fallow_delay = 900
In seconds. Clean dirty blocks that have been "idle" (not read or written) for fallow_delay seconds. Default is 15 minutes. Setting this to 0 disables idle cleaning completely.
dev.flashcache.<cacheddev>.fallow_clean_speed = 2
The maximum number of "fallow clean" disk writes per set per second. Defaults to 2.
...
(There is little reason to tune these)
dev.flashcache.<cachedev>.max_clean_ios_set = 2
Maximum writes that can be issued per set when cleaning blocks.
dev.flashcache.<cachedev>.max_clean_ios_total = 4
Maximum writes that can be issued when syncing all blocks.
Changing all these settings didn’t help us to reduce the load flashcache generated on the HDDs while cleaning dirty blocks.
Another problem we mentioned earlier was that we had a high sequential load passing through the cache (green X marks on the last image). It is possible to set a higher sequential threshold, which should have helped us at least to cache more sequential writes and reduce HDD utilization.
Unfortunately, it didn’t help because of flashcache’s architecture. If there are a lot of writes to the cache set, it will be overfilled with dirty blocks. And if there’s no place to cache a new data block, for example, if all blocks in the current set are dirty, then this block is placed on the HDD device. This behavior is called conflict miss or collision miss and is a known problem of the set associative cache.
Flashcache Operations Issues
Flashcache configuration management is hard. In fact, it uses sysctl for configuration. For example, if we have md2p9 as a cache device for ata-HGST_HUS726040ALE614_N8G8TN1T-part2, all Flashcache device options look like:
dev.flashcache.md2p9+ata-HGST_HUS726040ALE614_N8G8TN1T-part2.cache_all = 1
dev.flashcache.md2p9+ata-HGST_HUS726040ALE614_N8G8TN1T-part2.clean_on_read_miss = 0
dev.flashcache.md2p9+ata-HGST_HUS726040ALE614_N8G8TN1T-part2.clean_on_write_miss = 0
dev.flashcache.md2p9+ata-HGST_HUS726040ALE614_N8G8TN1T-part2.dirty_thresh_pct = 20
…
Imagine you are going to change the caching or cached device, then the new flashcache device is going to be created and you’ll have to change your sysctl.d configuration file. You need to remove previously used configuration and add new options for the new flashcache device. So it’s easier to have a custom script that deletes the old file and creates a new one, getting device names from the /proc/flashcache directory.
Then, to reduce the human factor, there should be a udev rule, which calls the script on a «dm» device «add» or «change» event. If you want to change some settings for some hosts, or some devices on a host (which is a rare case, but possible), you have to customize the script using a configuration management system. All these manipulations become complex and unintuitive.
Another drawback with flashcache is that it’s not in the kernel mainline. When the kernel API changes, it’s time to add one more:
#if LINUX_VERSION_CODE < KERNEL_VERSION (your version here) to the sources, add some code and rebuild the module. All of these problems forced us to look for another solution.
Bcache
Bcache is different from flashcache. It was initially developed by Kent Overstreet and is now actively maintained by Coly Li. It is merged into the kernel mainline, so we don’t need to worry too much about testing it with newer kernels.
Bcache doesn’t use a device mapper, it is a separate virtual device. Like flashcache, it consists of three devices:
- backing device — a slow, cached device;
- cache device — your fast NVMe;
- bcache device — the device used by an application.
For more information on this, refer to the documentation.
It supports write-back, write-through and write-around caching. As we mentioned earlier, good write-back caching is what we were looking for. Changing the cache mode is easy, we just have to write a new mode name to the sysfs file. These sysfs trees are created when new bcache devices are created.
echo writeback > /sys/class/block/bcache0/bcache/cache_modeIt looks much easier than configuring every device via a dynamically changed sysctl configuration file. And it is much easier because it’s possible to use udev rules to change settings, the same way as for the standard block device!
It is possible to create a bcache device with more than one backing device, but we don’t use this functionality. Instead, we split NVMe drives for every cache.
How Bcache Works
Bcache doesn’t use standard cache allocation policies, e.g. direct map or set-associative. Instead, it operates on b+tree. In this tree, it stores keys and pointers to the allocated data blocks. If it has some data to write, it prepares the key and allocates space for that data.
After the data is written, the keys are inserted into the btree. When there’s a read request to be served, bcache looks for a key in the btree. If there’s no such key, it just returns zeros, if a key is found, data is gathered via pointers. This request processing method makes conflict miss events impossible. The documentation can be viewed here. It’s not comprehensive, but it explains basic principles on how bcache operates.
We mentioned earlier that we want to control the speed of the write-back rate. And bcache makes this possible. It uses a PI controller to count the write-back rate.
The rate of write-back operations depends on the difference between the current amount of dirty blocks and the threshold. The more dirty blocks are over the threshold, the higher the write-back rate becomes. It also depends on the time the dirty data exceeds the threshold. The longer the threshold is exceeded, the higher the write-back rate becomes. You may find basic information on how PID controllers work on Wikipedia.
With modern kernels, we can set the minimum write-back rate, which is the lowest value of the rate, even if the count of dirty blocks has not reached the threshold yet. And there are two more settings: writeback_rate_p_term_inverse and writeback_rate_i_term_inverse. Both of these settings affect how fast the PI controller responds to the write load.
These features make bcache a really interesting solution, so we decided to test it a bit and try to run it in production.
Bcache Testing and Tuning
In this section we’ll be showing a few tuning options, some test results and fdatasync() behavior. Let’s start with basic tuning.
We already said that we need bcache to cache write requests and read requests. So the first thing to do is to set the write-back mode. Then turn sequential_cutoff off. This option tells bcache to pass through requests with a size greater than the specified value. A value of 0 means turn off this mechanism.
~$ echo writeback > /sys/class/block/bcache6/bcache/cache_mode
~$ echo 0 > /sys/class/block/bcache6/bcache/sequential_cutoff
There are also congestion thresholds in the bcache/cache directory, but we don’t change these, because they are high enough for us.
We used fio for testing:
[test]
ioengine=libaio
rw=randwrite
bs=4k
filename=/dev/bcache6
direct=1
fdatasync=10
write_iops_log=default
log_avg_msec=1000
filesize=8G
As you may see, we used more or less kind of default options. Option direct=1 prevents the use of page cache and enables the libaio engine to work properly. An fdatasync system call will be called after every 10 write operations to flush the device’s cache. And a few options to ask fio to write IOPS results to a file averaged for a second. This workload, of course, looks like a corner case, because in real life we don’t have this straight one-thread random write load all the time. But it’ll show us something about bcache behavior.
We’ve done a few tests with two types of cache state at the start: clean cache; and cache which slowed its write-back rate to a minimum after the previous test.
We cleaned the cache, and stats before testing were as follows:
rate: 4.0k/sec
dirty: 0.0k
target: 5.3G
proportional: -136.2M
integral: -64.5k
change: 0.0k/sec
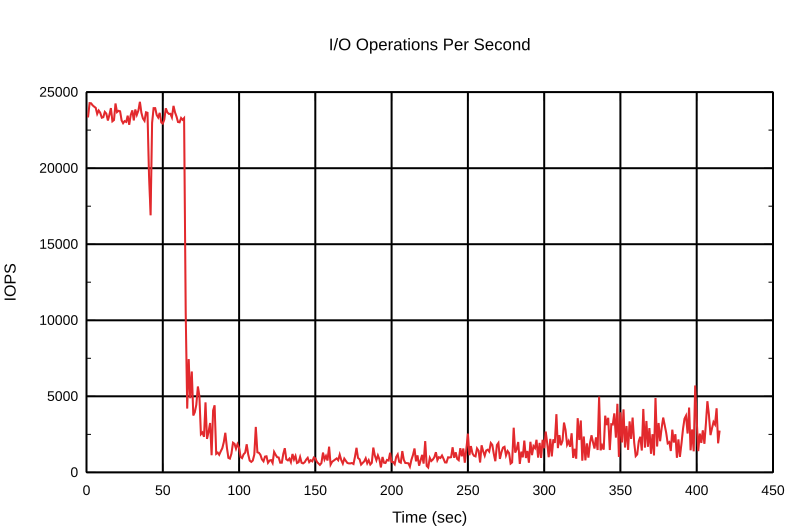
next io: -4035946msThese stats are from cat /sys/class/block/bcache6/bcache/writeback_rate_debug, and we’ll be showing them in this section. We started the test with default bcache settings. Let’s look at the results:
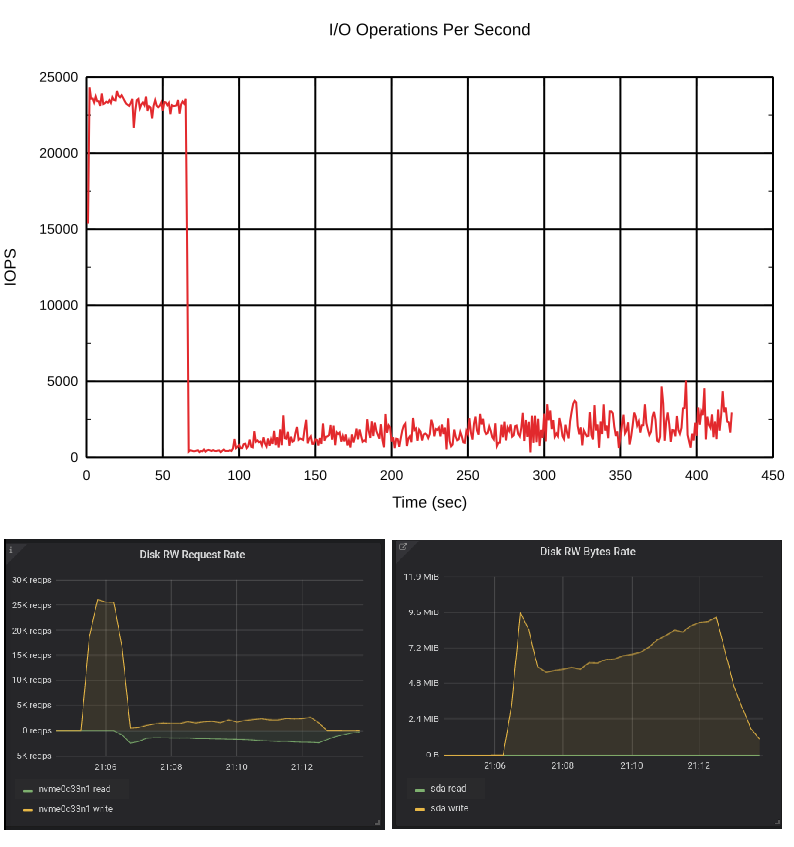
This is interesting. In the beginning, the cache was empty and we had about 25K write operations per second. But when the dirty data reached its threshold, it slowed down the write requests rate. How did that happen? The answer is fdatasync().
All flush requests are sent to the backing device too. When the number of dirty blocks becomes higher than the threshold, the bcache increases the write-back rate and writes data to the backing device. When the backing device is loaded with writes, it starts responding to the flush requests more slowly. You may run the same test and check it with iostat. It’ll show a lot of write requests to the backing device which are the flushes unless you use kernel >= 5.5, which has a specific counter for the flush requests.
The write-back rate increased fast and the backing device was heavily loaded.
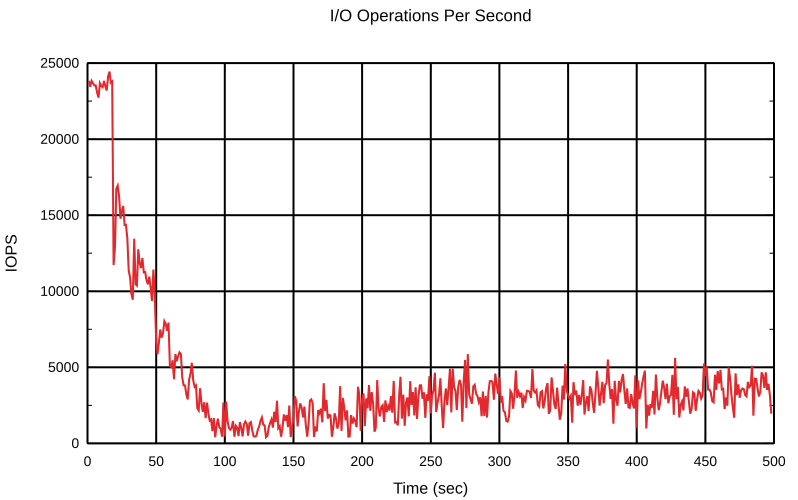
OK, let’s start this test once more, but now with different starting conditions:
rate:       	4.0k/sec
dirty:      	5.1G
target:     	5.3G
proportional:   -6.4M
integral:   	6.3M
change:     	-26.0k/sec
next io:    	552ms
The number of dirty blocks is close to the threshold, so we expect that it’ll get to the threshold fast and the bcache will react faster and the slowdown won’t be so aggressive.
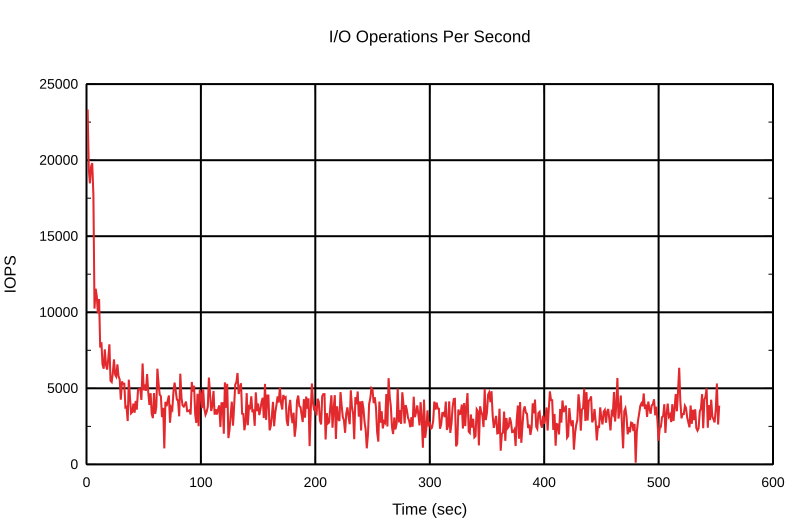
And so it is! OK, we’ve got the idea. Let’s change something that should have an effect on the write-back behavior. We mentioned earlier the writeback_rate_p_term_inverse and writeback_rate_i_term_inverse options. As you might have guessed, these options are inversed proportional and inversed integral terms.
~$ echo 180 > /sys/class/block/bcache6/bcache/writeback_rate_p_term_inverseThe default «p» is 40, so this change should significantly affect the write-back behavior. Make it less reactive. We started the test again with a clean cache.
State of write-back after it slowed the rate to the minimum:
rate:       	4.0k/sec
dirty:      	4.7G
target:     	5.3G
proportional:   -3.1M
integral:   	-39.5k
change:     	0.0k/sec
next io:    	357ms
And test again.
It’s clear to see that the bcache was much more gentle with its write-back rate. By the way, it was gentle in both directions — increasing and decreasing. Take a look at the number of dirty bytes after the first test with default settings and after the first test with a changed «p» term. There were fewer dirty blocks after it reached the minimum rate in the later one. It just took more time with a high inverse «p» term to decrease the write-back rate to the default.
Let’s play with the integral term a bit, too. The integral term shouldn’t play such a big role in the current conditions. The initial conditions are the same as for the previous tests.
echo 30000 > /sys/class/block/bcache6/bcache/writeback_rate_i_term_inverse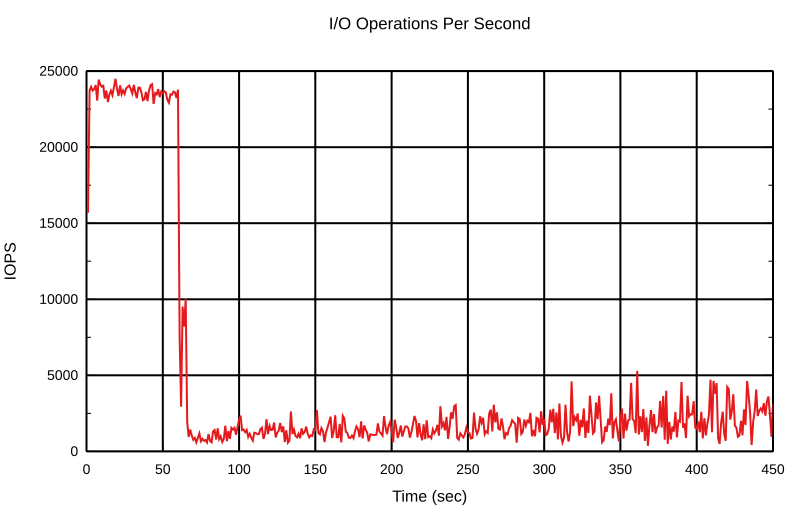
State of write-back after it slowed down the rate to the minimum:
rate:       	4.0k/sec
dirty:      	5.2G
target:     	5.3G
proportional:   -2.3M
integral:   	-0.5k
change:     	0.0k/sec
next io:    	738ms
And the second start:
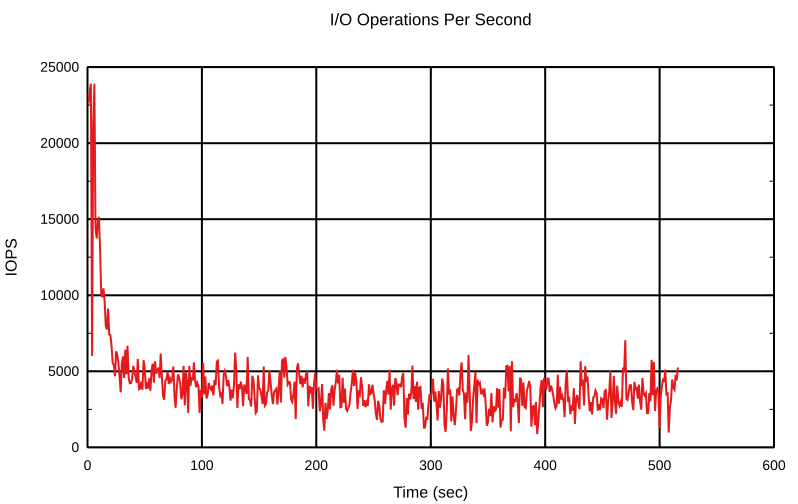
It can be seen that the integral term doesn’t play such a big role here. In fact the integral term affects the PI-controller’s speed and helps to reduce the noise from the input, for example short bursts of write operations on the bcache device. Playing with the PI-controller is really interesting, try it out with your real workload.
The good thing is that it’s possible to cache all the write requests, whether sequential or random. And its write-back rate depends on whether the load and cache are full. This is exactly what we were looking for.
Conclusion
We decided to use bcache in production and it didn’t let us down. Bcache in write-back mode works much better than flashcache did. We are also able to use relatively smaller cache devices than flashcache allowed us to.
We’ve started to set up all-new hosts on bcache and have seen many improvements in the system’s behavior. We’ve never seen those series of HDD drive utilization with bcache. When the whole system was under a high load, hosts with bcache showed much better latency than hosts with flashcache did, due to HDD saturation.