Netdata: Monitoring in Real Time
In previous posts, we looked at various issues related to monitoring, collecting, and saving metrics and different methods and tools for getting around them. In today’s article, we’ll be discussing yet another tool that simplifies these processes: Netdata.
Unlike other analytical tools, Netdata is designed for gathering and visualizing metrics in real time (and when necessary, a backend can be incorporated for gathering and saving collected metrics).
Using Netdata, we can easily follow a large number of indicators: stats on processor usage, memory consumption, I/O operations, network usage, and much more. Netdata is equipped with plugins for tracing various services: Postfix, Squid, PHP-FPM, and more.
In this article, we’ll look at how to install and configure netdata on a server running Ubuntu 16.04.
Installation
Before we install Netdata, we have to make sure we have all the required dependencies:
$ sudo apt-get install git zlib1g-dev uuid-dev libmnl-dev gcc make autoconf autoconf-archive autogen automake pkg-config curl
$ sudo apt-get install python python-yaml python-mysqldb python-psycopg2 nodejs lm-sensors netcat
Then we clone the official repository:
$ git clone https://github.com/firehol/netdata.git --depth=1 ~/netdata
Next we run:
$ cd ~/netdata
$ sudo ./netdate-installer.sh
The last command launches a script to automatically compile and install Netdata. Once the installation is complete, Netdata can be launched. We can optimize performance by changing just a few parameters. We’ll take a closer look at how to do this in the following sections.
Enabling Memory Deduplication
We’ll start by activating KSM (kernel same-page merging). This technology lets us merge memory pages from different processes for shared usage. As the creators of Netdata say in their own blog: this can improve performance by 40-60%.
We run the command:
$ sudo nano /etc/rc.local
rc.local (short for run control) is a script that runs after all other services and processes have been launched. We’ll have to edit this file:
#!/bin/sh -e
#
# rc.local
#
# This script is executed at the end of each multiuser runlevel.
# Make sure that the script will "exit 0" on success or any other
# value on error.
#
# In order to enable or disable this script just change the execution
# bits.
#
# By default this script does nothing.

echo 1 > /sys/kernel/mm/ksm/run
echo 1000 > /sys/kernel/mm/ksm/sleep_millisecs

exit 0
The first command writes a 1 to the file /sys/kernel/mm/ksm/run and thus activates KSM; the second shows the KSM daemon should launch once a second and check 100 pages for duplicates.
KSM will be active when the server restarts.
Setting Expirations for Metrics in Storage
Netdata settings are saved in the configuration file /etc/netdata/netdata.conf.
In the section [global] (general settings), we’ll find the history parameter. The value is the time (in seconds) that metrics are saved for. This value directly affects the amount of memory consumed:
- saving data for 3600 seconds (1 hour) consumes 15 MB of RAM
- 7200 seconds (2 hours) — 30 MB
- 14400 seconds (4 hours) — 60 MB
- 28800 seconds (8 hours) — 120 MB
- 43200 seconds (12 hours) — 180 MB
- 86400 seconds (1 day) — 360 MB
These numbers are for standard dashboards; more or less memory may be consumed for custom dashboards. We’ll set our value (for us it’s 14 400) and save our changes.
More detailed information about configuring Netdata can be found in the official documentation.
Dashboards: Structure and Functions
We can pull up the Netdata dashboard in our browser at the address http://[server IP address]:19999. Here we’ll find all our graphs and stats on metrics. It looks similar to the Grafana web interface, which we’ve written about before.
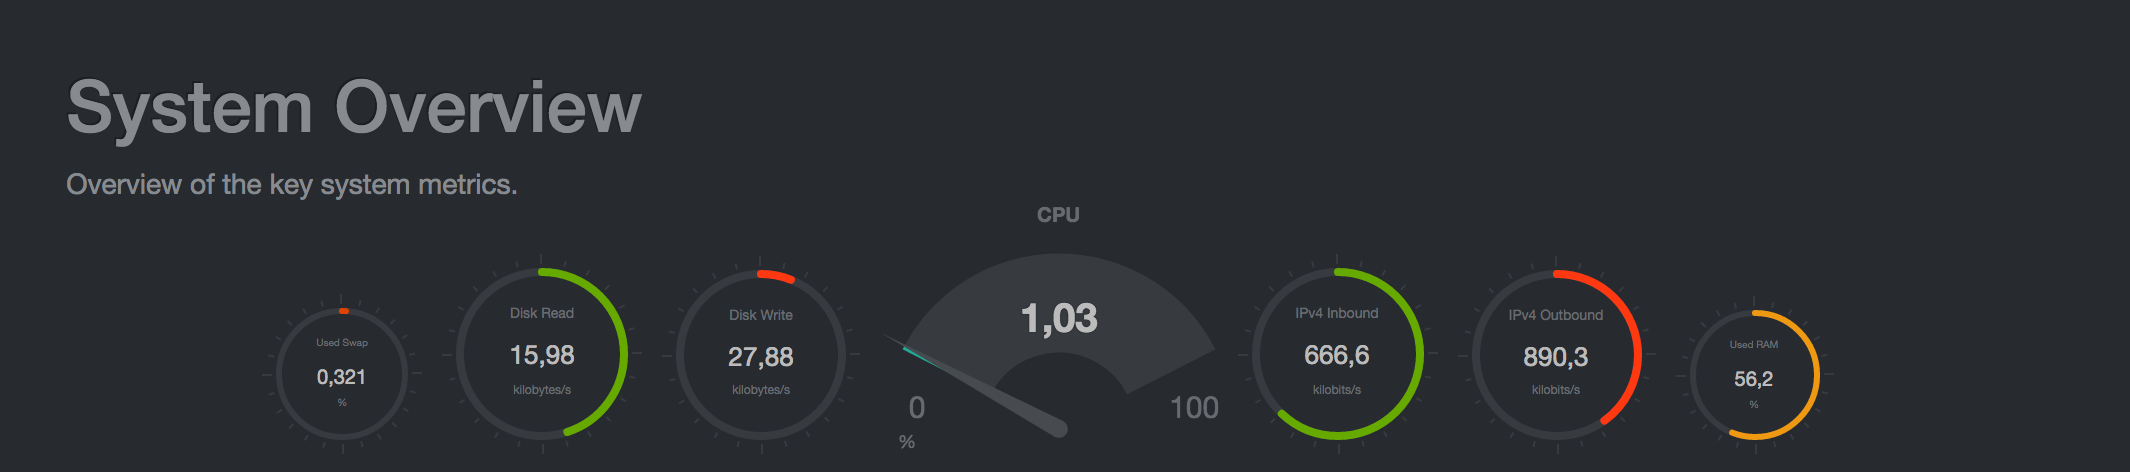
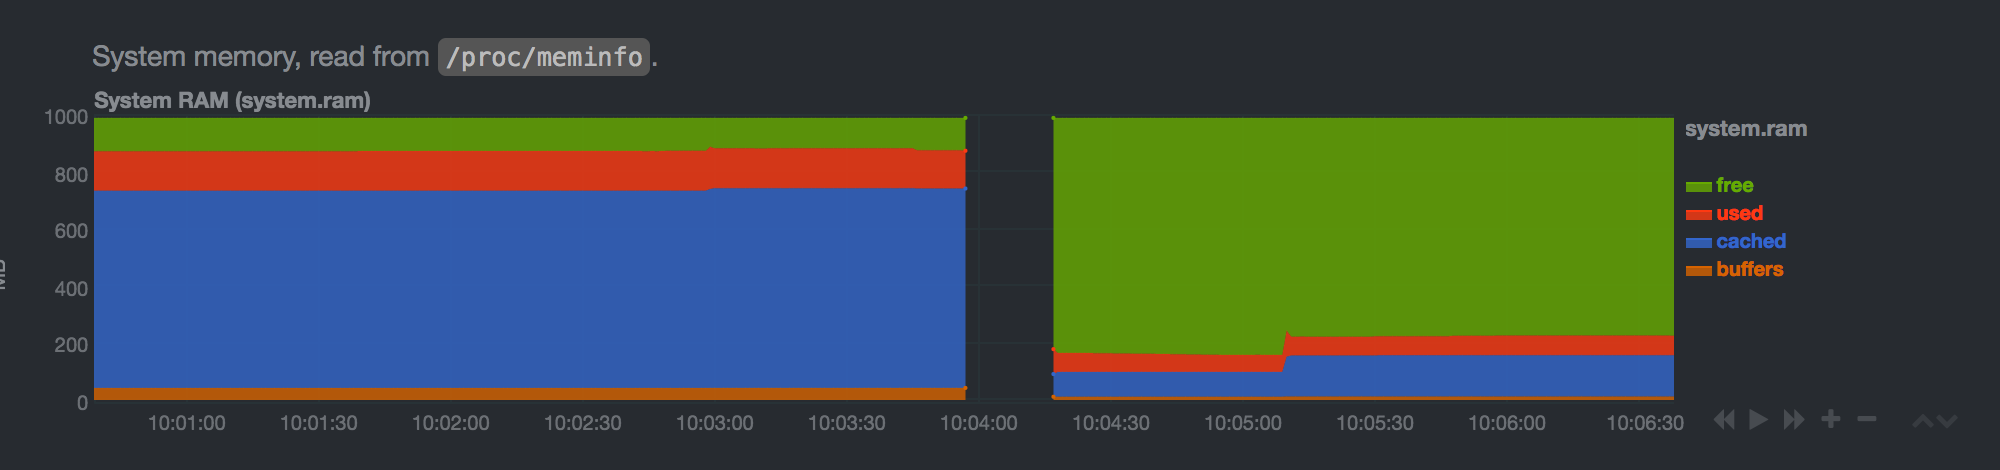
The very first dashboard shows us the key system metrics:
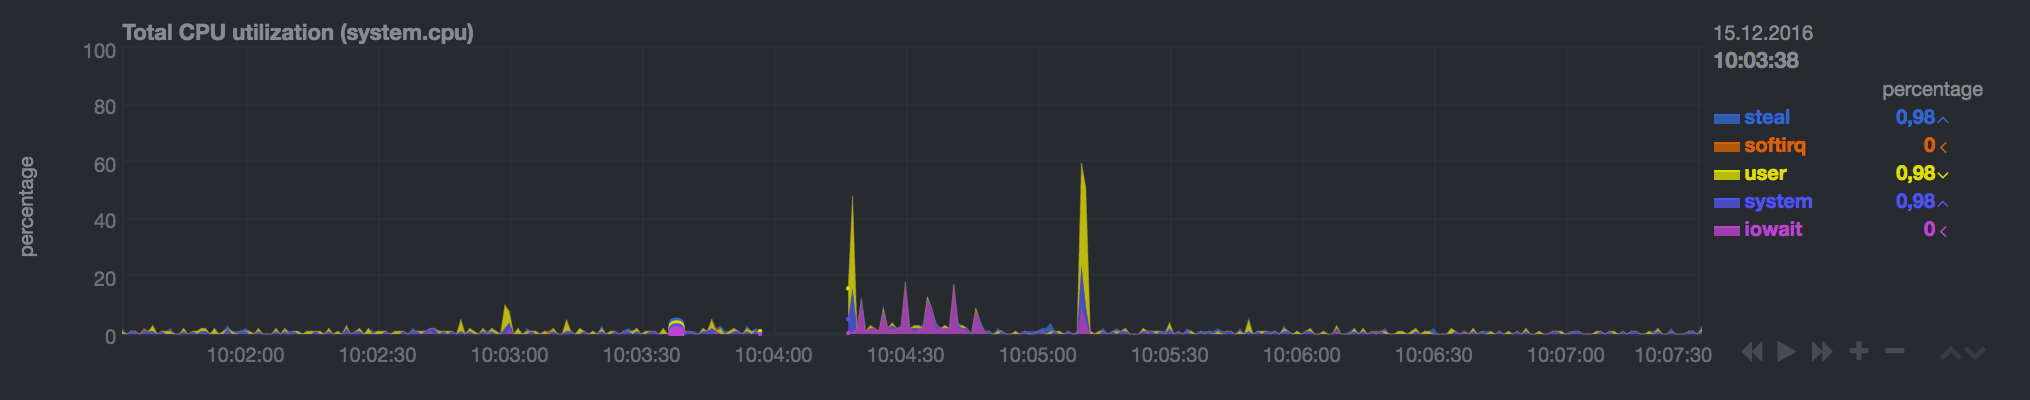
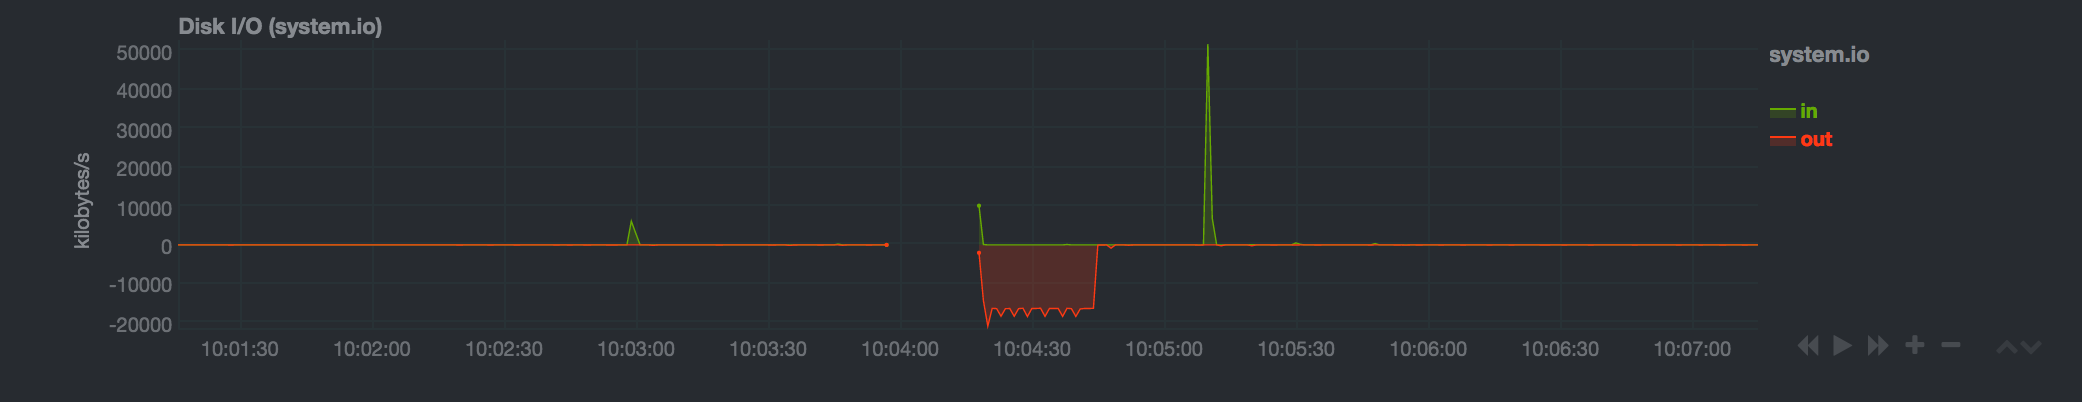
The next graphs show processor usage, memory consumption, I/O operations, network activity, and more:
We can increase (or decrease) time intervals on the graphs: this is done by moving the mouse over the dashboard, holding the SHIFT key and turning the mouse’s scroll wheel. We can add other graphs to this page; more information on this can be found here.
Configuring Alarms
Some alarms are configured “out of the box” for Netdata, in particular:
- alarms that a monitored application has halted
- alarms about network interface errors
- alarms about insufficient disk space
Netdata also calculates free disk space and how much time it will be until the disk is full, provided it’s less than 48 hours.
As we can see, these alerts are more than enough for most cases. If you need to configure custom alerts, Netdata has special templates described in the configuration files in /etc/netdata/health.d.
Let’s look at the structure and syntax of these templates. We’ll start with the following example:
template: disk_space_usage
      on: disk.space
    calc: $used * 100 / ($avail + $used)
   units: %
   every: 1m
    warn: $this > (($status >= $WARNING ) ? (80) : (90))
    crit: $this > (($status == $CRITICAL) ? (90) : (98))
   delay: up 1m down 15m multiplier 1.5 max 1h
    info: current disk space usage
      to: sysadmin
This is all fairly intuitive: the template shows us when low disk space warnings have to be sent out. Let’s take a look at the structure.
In the template field we have the template name. The on field tells us the template needs to be applied to every graph where context=disk.space (i.e. all dashboards with I/O operation stats).
We’re most interested in the calc field: here we have the formula for calculating critical free disk space. Our formula is $used * 100 / ($avail + $used). It’s easy to guess that $used is the amount of disk space in use, and $avail is free disk space.
In the units field, we can see that the value is expressed as a percentage; in the every field, we see that checks will be run once a minute.
Pay close attention to the warn and crit fields: these values are the conditions for sending warnings (in our case it’s 80-90%) and messages about critical values (98%).
This is a very brief description; more detailed information on templates can be found here.
Limitations
Like any tool, Netdata has its limits and setbacks. The first is that Netdata can never be used for monitoring server clusters: it would have to be installed on every server separately. If these servers can be accessed over the Internet, then the Netdata interface has to be closed to external visitors (hackers can use monitoring data to plan a DoS attack).
Another drawback is that the extremely limited number of backends supported for saving metrics: the only ones advertised today are Graphite and OpenTSDB. Of course, other backends can be attached (see here), but this isn’t all that easy to do, especially for new users who don’t have the programming skills.
We also have to add its lack of detailed and poorly structured documentation (which is only available on the Github wiki); it’s currently quite difficult to find the answers you need.
Conclusion
In this article, we gave a brief overview of Netdata’s capabilities. If you want to see Netdata in action, the developers have opened demo servers, where you can look and play around. If you already use or have used Netdata, please share your experience or impressions in the comments below.
As per tradition, below are some useful links for anyone wishing to learn more:
- https://github.com/firehol/netdata/wiki — official Netdata documentation (not very detailed and a bit chaotic, as we mentioned above)
- https://www.digitalocean.com/community/tutorials/how-to-set-up-real-time-performance-monitoring-with-netdata-on-ubuntu-16-04 — good installation and configuration instructions for Netdata (we referenced this when writing our article)
- https://www.monitoring-fr.org/2016/04/netdata-real-time-performance-monitoring/ — fair overview of Netdata’s capabilities (in French)